
See every asset
more clearly.
Transform vertical transportation data into the performance, cost, compliance, and capital planning insight owners need to make better decisions across every asset.
What We Built
A complete view of your portfolio's performance.
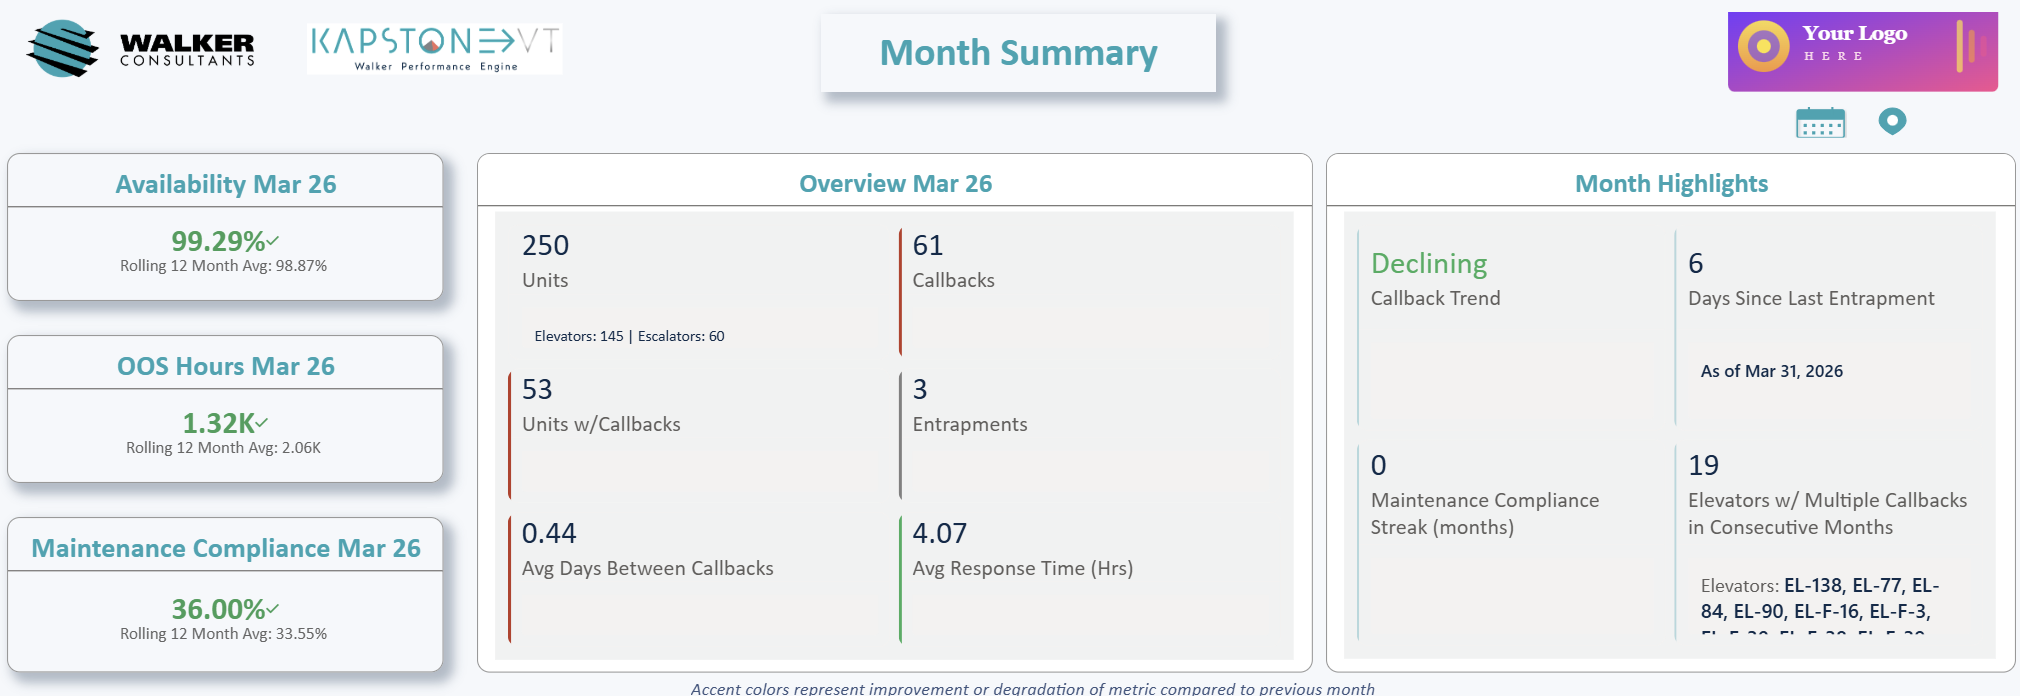
Summary
Why it Matters
The Walker difference.
Outcome-Focused Reporting
Every view is designed to answer a real question. You get answers, not noise.
Built by VT Specialists
Walker’s Vertical Transportation team brings field experience to every metric and benchmark.
Scales With Your Portfolio
From a single property to a national portfolio, the platform grows with your asset base.
Dashboard Capabilities
Six ways we give you the upper hand.
Monthly Performance Tracking
Review callback rates and availability figures month by month, benchmarked against your own historical averages.
Portfolio-Wide Overview
One unified view across all buildings and units. Compare properties side by side and see which assets need attention.
Equipment Performance Rankings
Every elevator and escalator is scored and ranked against the full portfolio to identify lowest performing assets.
Compliance & Inspection Status
Track inspection due dates, pass/fail status, and upcoming obligations across every unit.
Service Labor Breakdown
Understand where maintenance hours are being spent by building and by technician.
Automated Narrative Summaries
Plain-language insights generated from your data, surfacing performance shifts and anomalies without manual analysis.
Performance Monitoring
Know if performance is improving, month over month.
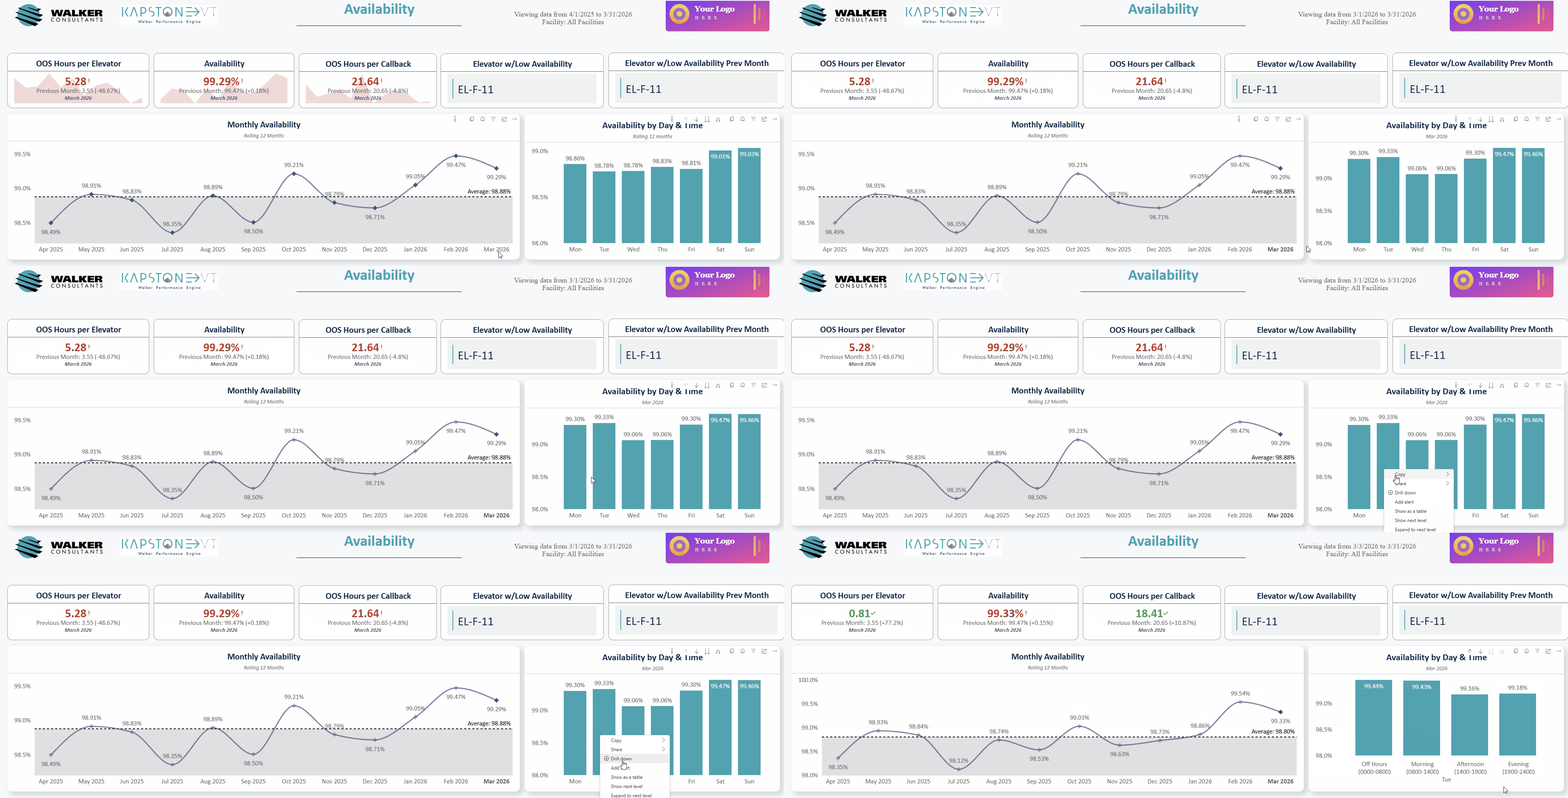
The dashboard is built around a monthly reporting rhythm. Select any month to see current callback rates and availability side by side with your historical average — so you always know whether things are getting better or worse.
- Current-month KPIs benchmarked against portfolio history
- Directional trend indicators — improving, stable, or declining
- Availability percentage with month-over-month movement
- Auto-generated performance summaries in plain language

Equipment Intelligence
See every elevator ranked best to worst.
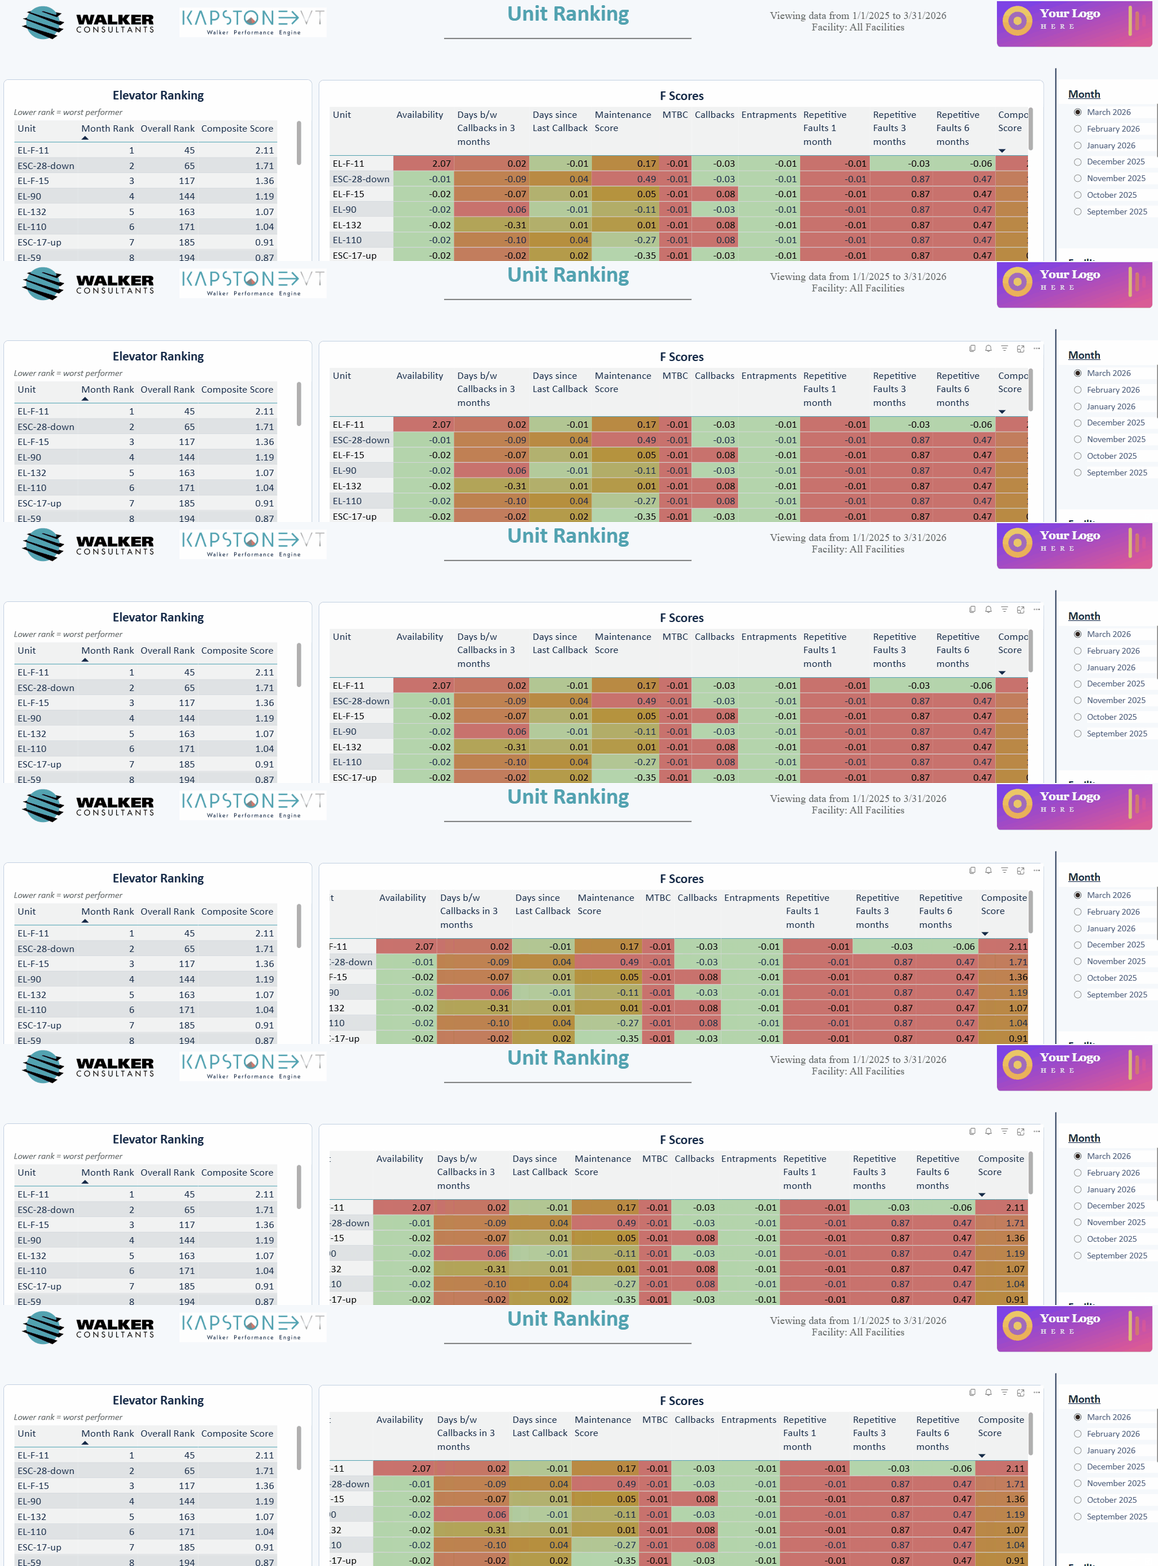
Each unit in your portfolio is evaluated across multiple performance dimensions and assigned a composite score. The result is a clear, objective ranking that shows you exactly where to focus capital investment and maintenance attention.
- Objective, multi-factor performance scores per unit
- Full portfolio ranked from highest to lowest performer
- Cross-building comparative benchmarking
- Quickly identify which units are investment priorities
Compliance Management
Never miss an inspection deadline again.
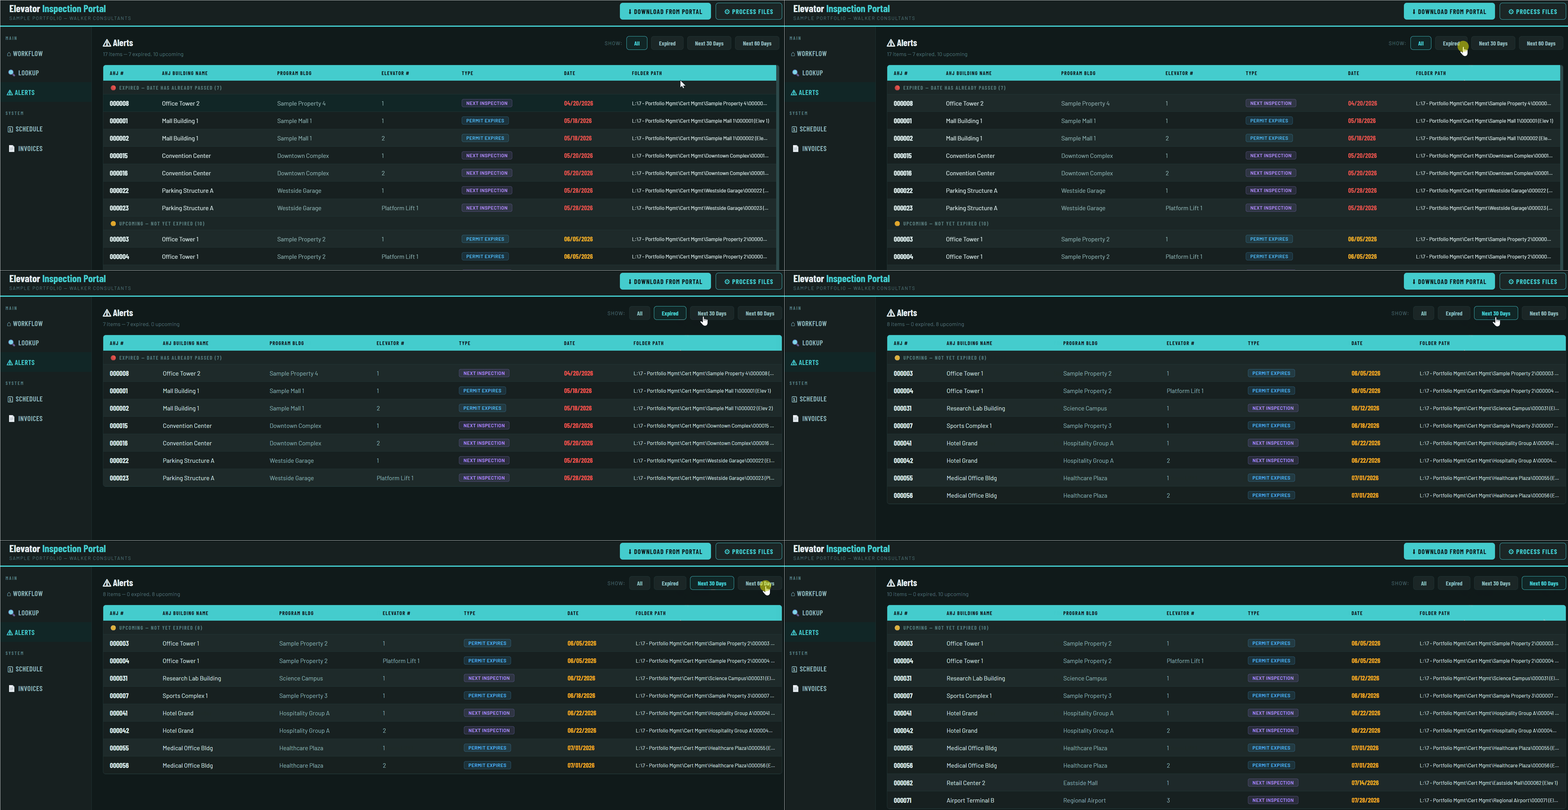
Statutory compliance is non-negotiable. The dashboard tracks every unit’s inspection status, due dates, and pass/fail outcomes — giving you a complete compliance picture without digging through spreadsheets or service records.
- Pass/fail status for every unit in the portfolio
- Days-remaining countdown for upcoming inspection due dates
- Instant portfolio-wide compliance rate at a glance
- Audit-ready records for all completed inspections
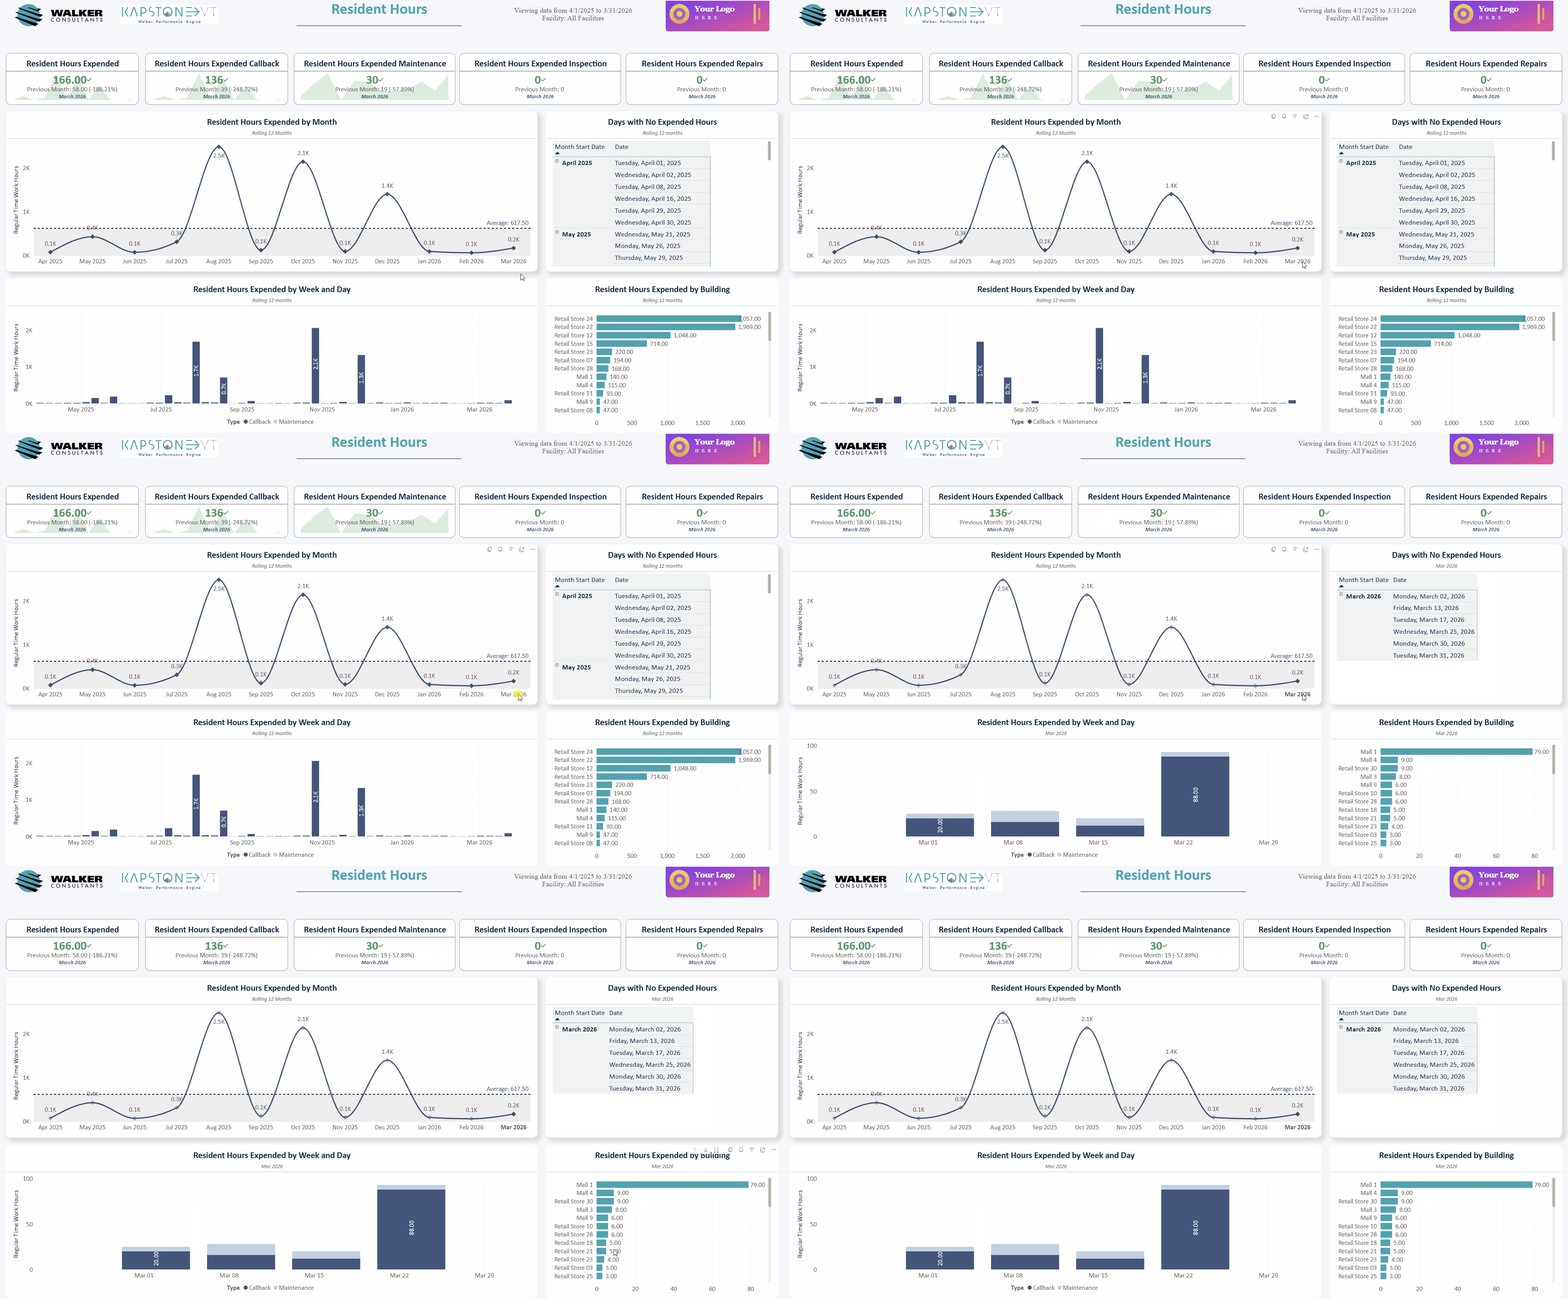
Service Accountability
See exactly where service hours are going.
Maintenance contracts are only as good as the work being done. Our labor analytics show you hours invested per technician and per building — so you can verify service delivery, identify over- or under-serviced assets, and negotiate from a position of knowledge.
- Hours breakdown by technician across the full portfolio
- Building-level service allocation at a glance
- Month-over-month labor trend indicators
- Supports informed contract reviews and renewals